I was helping a peer of mine design, plan and execute some level of performance testing on MVC Web APIs and as I go through some of the documentation in VSO (Visual Studio Online), I ran into questions such as gathering counters, custom events and “real time monitoring” of performance execution. Given that our servers are on azure, I don’t have direct access to the servers where I can get specific information. More importantly while running performance/load testing in Visual Studio it doesn’t provide specific counters that we want to monitor such as exceptions/sec, etc… You do get this information “after” the execution happens which produces detailed results but what If you want to monitor your site (in this case Web APIs hosted in Azure) during performance execution or at higher level just want to monitor activities, events, requests, etc… on your Azure Site hosting Web APIs. Application Insights immediately came to my mind but for Web APIs, it’s not as simple as plugging in some javascript code compared to MVC Web App.
Application Insights works by adding an SDK into your app, which sends telemetry to the Azure portal. This allows us to detect issues, solve problems and continuously improve your applications. It also allows us to quickly diagnose any problems in your live application. Understand what your users do with it. (You will see this below)
For Web APIs, you need to instrument code (telemetry) in the Web Api itself (controller). As I go through this documentation: “Custom events and metrics with the Application Insights API”, it was apparent that not all app application insights supported api methods are needed. We just needed to use the following:
TrackException Log exceptions for diagnosis. Trace where they occur in relation to other events and examine stack traces.
TrackRequest (Start and Stop) Log the frequency and duration of server requests for performance analysis.
TrackTrace Diagnostic log messages. You can also capture 3rd-party logs.
That said, let’s get started!
Let’s start by adding assembly references to your MVC Web API. Using Nuget Manager, install the following Nuget Packages:
– Application Insights API
– Application Insights API for Web Applications
– Application Insights Telemetry SDK for Services
Once these packages are installed in your API, project, it will make some modifications in your web.config file and add another config “ApplicationInsights.config”. This file contains most of the settings and information you need to modify what components you want to track and instrument. The most important section of this config is the instrumentation key:
<InstrumentationKey>XXXXXXX-1ed4-484c-a5a0-3df1aba5XXXX</InstrumentationKey>
This key contains the value for which application insights resource you will use to track usage for your Web API. For more information, see this article:
http://azure.microsoft.com/en-us/documentation/articles/app-insights-create-new-resource/
The code: Given that we just wanted to get started with Application Insights, we want to track requests and exceptions using the most basic telemetry. As I started to write the code for instrumenting data, I’ve approached my peer dev to see if she wants to pair on this. Luckily she already has stash (in GIT terms) or shelved (in TFS terms) telemetry code. I have to give Kudos to one our Devs who mostly did the work. Thank you Nemo Hajiyusuf!
The INTERFACE: The interface was simple and we supported the following app insights api methods:
public interface ITelemetryTracker
   {
       void TrackException(Exception ex);
       void TrackTrace(string message, SeverityLevel severity);
       void TrackEvent(string eventName, Dictionary<string,string> properties );
       Stopwatch StartTrackRequest(string requestName);
       void StopTrackRequest(string requestName, Stopwatch stopwatch);
   }
The IMPLEMENTATION:
public class TelemetryTracker : ITelemetryTracker
    {
        private readonly TelemetryClient _telemetry = new TelemetryClient();

        public void TrackException(Exception ex)
        {
            _telemetry.TrackException(ex);
        }

        public void TrackTrace(string message, SeverityLevel severity)
        {
            _telemetry.TrackTrace(message, severity);
        }

        public void TrackEvent(string eventName, Dictionary<string,string> properties )
        {
            _telemetry.TrackEvent(eventName,properties);

        }

        public Stopwatch StartTrackRequest(string requestName)
        {
            // Operation Id is attached to all telemetry and helps you identify
            // telemetry associated with one request:
            _telemetry.Context.Operation.Id = Guid.NewGuid().ToString();
            return Stopwatch.StartNew();

        }

        public void StopTrackRequest(string requestName, Stopwatch stopwatch)
        {
            stopwatch.Stop();
            _telemetry.TrackRequest(requestName, DateTime.Now,
                stopwatch.Elapsed,
                "200", true);  // Response code, success
        }
    }
The USAGE: Now it’s up to you which parts of your web api code (in this case our your MVC Web API controllers). Here’s a sample snippet for one of our supported web methods:
From the class level:
private readonly ITelemetryTracker _telemetryTracker;
We invoke the constructor (Yes, we use dependency injection):
public SomeController(IHelper Helper, ITelemetryTracker telemetryTracker)

       {
           _helper = Helper;
           _telemetryTracker = telemetryTracker;
       }
The Web Method
[System.Web.Http.HttpGet]
        [System.Web.Http.Route("xxxxx")]
        public HttpResponseMessage Get([FromUri] string Id)
        {
            const string requestName = "api/1/Gets";
            try
            {
                //Track the request in App insight
                var stopwatch = _telemetryTracker.StartTrackRequest(requestName);
                _telemetryTracker.TrackTrace(string.Format("Get: processing for Id: {0}", Id),SeverityLevel.Information);
                if (string.IsNullOrWhiteSpace(Id))
                {
                    return new HttpResponseMessage(HttpStatusCode.BadRequest)
                    {
                        Content = new StringContent("Missing Id in the request")
                    };
                }
                var preferences = _helper.Gets(Id);
                Trace.TraceInformation("Get: Done processing for Id: {0}", Id);
                _telemetryTracker.TrackTrace(
                    string.Format("Get: Done processing for Id: {0}", Id),
                    SeverityLevel.Information);
                _telemetryTracker.StopTrackRequest(requestName,stopwatch);
                return Request.CreateResponse(HttpStatusCode.OK, preferences);

            }
            catch (Exception ex)
            {
                Trace.TraceError("Get Exception: {0}", ex.ToString());
                //Track the exception in App Insights
                _telemetryTracker.TrackException(ex);
                return new HttpResponseMessage(HttpStatusCode.InternalServerError)
                {
                    Content = new StringContent("Unexpected error happen while processing Get. Please try again.")
                };

            }
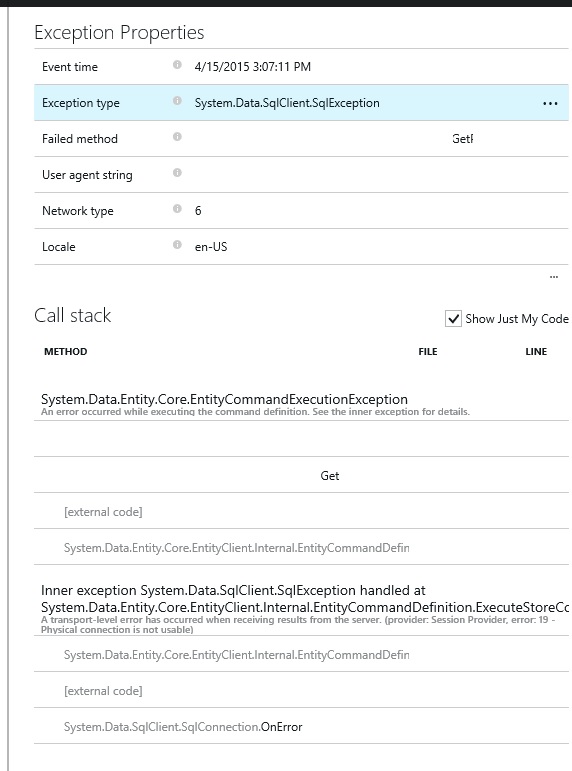
At this point, we’ve instrumented the data to one of our application insights resource. We then started running our perf and able to see the results dynamically and realtime on the server. It even provides us stack trace information based on the trackexception call.
With application insights, we’re able to quickly monitor our tests, more importantly exceptions happening during that session. This is also realtime so any other requests sent to our API, we see real time as well. There are more metrics that applications offer, for now, we’re happy that we were able to collect information (even custom) from our web api
The RESULTS: