Continuous Integration in VSTS using .Net Core (with Code Coverage), NUnit, SonarQube: Part 3: VSTS SonarQube Build Task

What is SonarQube? From SonaQube’s WebsiteSonarQube provides the capability to not only show health of an application but also to highlight issues newly introduced. With a Quality Gate in place, you can fix the leak and therefore improve code quality systematically.”

In short, it’s a continuous integration process targeting developers to set triggers and/or thresholds on maintaining quality code using gates.

Here’s a high-level screenshot of what SonarQube has to offer (Actual screenshot of an application that went through SonarQube’s capabilities:

image

Note that the instance of SonarQube that I’ve used here is their SaaS based offering – SonarCloud. I didn’t want to go through the hassle of hosting my own instance of SonarQube rather use the SaaS based offering as a guideline. In my opinion, SaaS based offerings are better options for medium to enterprise size companies for multiple reasons (Cost, Support, Maintenance, etc…)

To see detailed description of what SonarQube has to offer: https://www.sonarqube.org/features/clean-code/

Personally, I love everything what SonarQube has to offer. Note that SonarQube can also be self-hosted, If you want to host SonarQube within your IT shop, you can step by step directions here: https://www.sonarqube.org/downloads/

Let’s go through setting up SonarQube in VSTS:

Step 1: Prepare analysis on SonarQube

NOTE: Make sure that this task comes before any application build task. This should be the first task. In my example, this task comes after restore Nuget step. This shouldn’t affect how the analysis works. Nuget restore is pretty much restoring Nuget packages for the given .Net solution/project(s).

This is the most crucial step of the process. This what sets all the properties in build time. The fields you need to enter here are both the Project Key and Project Name. These values can be obtained through SonarQube’s administration page or the landing page of your project in SonarQube.

One important field missing here is the Organization. This is needed to publish to SonarQube. As of writing this post, version 4.x of this task will fail unless you specifically add an additional property to set the organization. You set this by expanding “Advanced” on the task and typing:

sonar.organization=<Org Value>

Both Org and Project Keys are specified as well in the project landing page in SonarQube’s site.

image

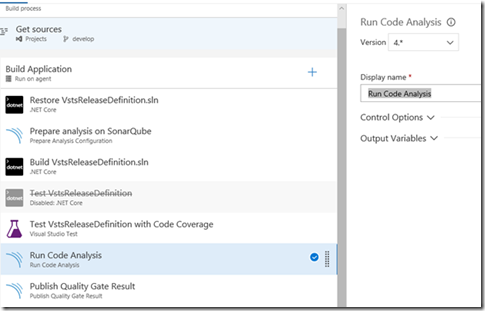
Step 2: Run Code Analysis

This step should come after a successfully test task for your build. The results from the unit tests are gathered (including code coverage), analyzes the results and preps the proper files for publishing to SonarQube.

image

Step 3: Publish Quality Gate Result

This is the final step. It should come right after the Code Analysis task. No settings are done here since all settings have been properly set in the first step (Prepare analysis on SonarQube).

image

A successful build with SonarQube integration looks like this:

image

Continuous Integration in VSTS using .Net Core (with Code Coverage), NUnit, SonarQube: Part 2: VSTS Build Definition Setup – .Net Core and NUnit

If you haven’t setup your .Net Core project/s for code coverage instrumentation, see my previous post: Part 1: .Net Core Project Setup – Code Coverage.

That said, let’s go through the settings for enabling code coverage in VSTS builds. The basic structure of CI build definition would be:

  1. Build the application
  2. Run Tests (Unit Tests with Code Coverage)
  3. Publish Artifacts

In this post, I’ll skip over using NUnit as a test framework for .Net Core. For using NUnit as a test framework, see my previous post: Using NUNIT Test Framework do validate deployments in VSTS Release Management

image

Note from the image above that we’ve disabled the Dotnet test task because code coverage is currently not supported on dotnet.exe CLI (as of writing of this post)

However, vstest.console.exe does support code coverage. This is the task we’ve enabled to run our unit tests for code coverage instrumentation as well as running the tests from NUnit written code. Vstest.console.exe automatically detects NUnit tests since part of the restore nuget package includes the NUnit test adapters.

The important note here is to ensure that you properly setup the vstest task in the build definition and it’s settings:

  • Ensure that you have code coverage enabled option
  • Ensure that you are pointing to the .runsettings file for further code coverage settings
  • Install the NUnit adapters as part of your test project

Running the build yields the following result.

image

At this point, you can download the code coverage file and open the result in Visual Studio for further inspection.

You may have noticed that in my build, I also have tasks for SonarQube. What is SonarQube and why use it? For this, see part 3 (final) post for this series: Part 3: VSTS SonarQube Build Task

Continuous Integration in VSTS using .Net Core (with Code Coverage), NUnit, SonarQube: Part 1: .Net Core Project Setup – Code Coverage

There are 2 ways to discover and execute unit tests using Microsoft developed test harnesses:

  • Vstest.console.exe = This is the command-line used to execute tests within/embedded in Visual Studio IDE
  • Dotnet.exe = This is the command line interface (CLI) specific to .Net Core Projects

Documentation for Vstest.console.exe is documented here: https://msdn.microsoft.com/en-us/library/jj155796.aspx

For .Net Core Projects: https://docs.microsoft.com/en-us/dotnet/core/tools/dotnet-test?tabs=netcore2x

The primary difference between both is that vstest.console.exe can execute tests developed in .Net Framework and .Net Core while dotnet.exe is specifically for .Net Core

An example of executing tests for the same assembly domain (test project) would be:

VSTest.Console.exe:

vstest.console.exe <testassembly>.dll (Pointer to the compiled Assembly)

Dotnet.exe:

dotnet test <testassemblyproject>.csproj (Pointer to the actual .Net Core Test Project)

The issue with dotnet.exe (CLI) is that Code Coverage doesn’t work. In order for code coverage to work on .Net Core projects, you need to:

  1. Edit the .Net Core projects you want to instrument for code coverage
  2. Use vstest.console.exe and supply /EnableCodeCoverage switch

Edit the .Net Core project/s for code coverage instrumentation

When you run unit tests in visual studio and select the option to “Analyze Code Coverage for Selected Tests” (as seen below), by default, code coverage results will not be captured.

image

As of writing of this post, the fix is to modify the project file and enable DebugType to Full on the propertygroup section of the project file.

image

Save the project file and run the unit tests again by selecting the option: to “Analyze Code Coverage for Selected Tests” and you’ll see similar results as shown below.

image

Use vstest.console.exe and supply /EnableCodeCoverage switch

As you saw within Visual Studio, running tests with code coverage can be trigged via a simple click on the context menu. If you want to execute your unit test with code coverage in a command line, you invoke /EnableCodeCoverage switch.

vstest.console.exe <testassembly>.dll /EnableCodeCoverage

The result would be an export of the code coverage results to a .coverage file. You can then open the file within Visual Studio to inspect the results. See screenshot below:

image

Setting up your .Net Core projects appropriately using the preceding steps should give you the proper code coverage numbers. More importantly, this allows you to seamlessly integrate with various build systems. Additionally, here are some tips and practices around code coverage:

Use a test .runsettings

Use a test .runsettings file to exclude assemblies you don’t want to instrument. The .runsettings file can be used on how tests are executed from vstest.console.exe. For more information, see the following: Configure unit tests by using a .runsettings file

Here an example on how you would want to exclude piece of code not to be measured for code coverage:

<DataCollectionRunSettings>
    <DataCollectors>
      <DataCollector friendlyName="Code Coverage" uri="datacollector://Microsoft/CodeCoverage/2.0" assemblyQualifiedName="Microsoft.VisualStudio.Coverage.DynamicCoverageDataCollector, Microsoft.VisualStudio.TraceCollector, Version=11.0.0.0, Culture=neutral, PublicKeyToken=b03f5f7f11d50a3a">
        <Configuration>
          <CodeCoverage>
            <ModulePaths>
              <Include>  
                <!-- Include all loaded .dll assemblies -->  
              </Include> 
              <Exclude>
                <!-- Exclude all loaded .dll assemblies with the words moq, essentially regex -->
                <ModulePath>.*\\[^\\]*moq[^\\]*\.dll</ModulePath>
                <ModulePath>.*\\[^\\]*Moq[^\\]*\.dll</ModulePath>
              </Exclude>
            </ModulePaths>
            <!-- We recommend you do not change the following values: -->
            <UseVerifiableInstrumentation>True</UseVerifiableInstrumentation>
            <AllowLowIntegrityProcesses>True</AllowLowIntegrityProcesses>
            <CollectFromChildProcesses>True</CollectFromChildProcesses>
            <CollectAspDotNet>False</CollectAspDotNet>s
            <Attributes>
              <Exclude>
                <Attribute>^System.Diagnostics.CodeAnalysis.ExcludeFromCodeCoverageAttribute$</Attribute>
              </Exclude>
            </Attributes>
          </CodeCoverage>
        </Configuration>
      </DataCollector>
    </DataCollectors>
  </DataCollectionRunSettings>

To use the .runsettings file, in Visual Studio, click on Test, Test Settings, Select Test Settings File (see below image)

SNAGHTML2d4683

[ExcludeFromCodeCoverage] attribute

Use [ExcludeFromCodeCoverage] attribute wherever appropriate. When a section of code is decorated with this attribute, that section of the code will be skipped for code coverage. Why? In certain cases, you don’t want code to be measured with code coverage. An example would be entity objects that have default property setters (get / set) that has no functionality. If there is “NO” logic developed on either the get and/or set property why measure it?

This ends the first part of this series, on the next part (VSTS Build Definition Setup – .Net Core and NUnit), we will hook up the test tasks in VSTS to include code coverage reporting.